On the results page you will find an overview of the progress of all groups divided by category. 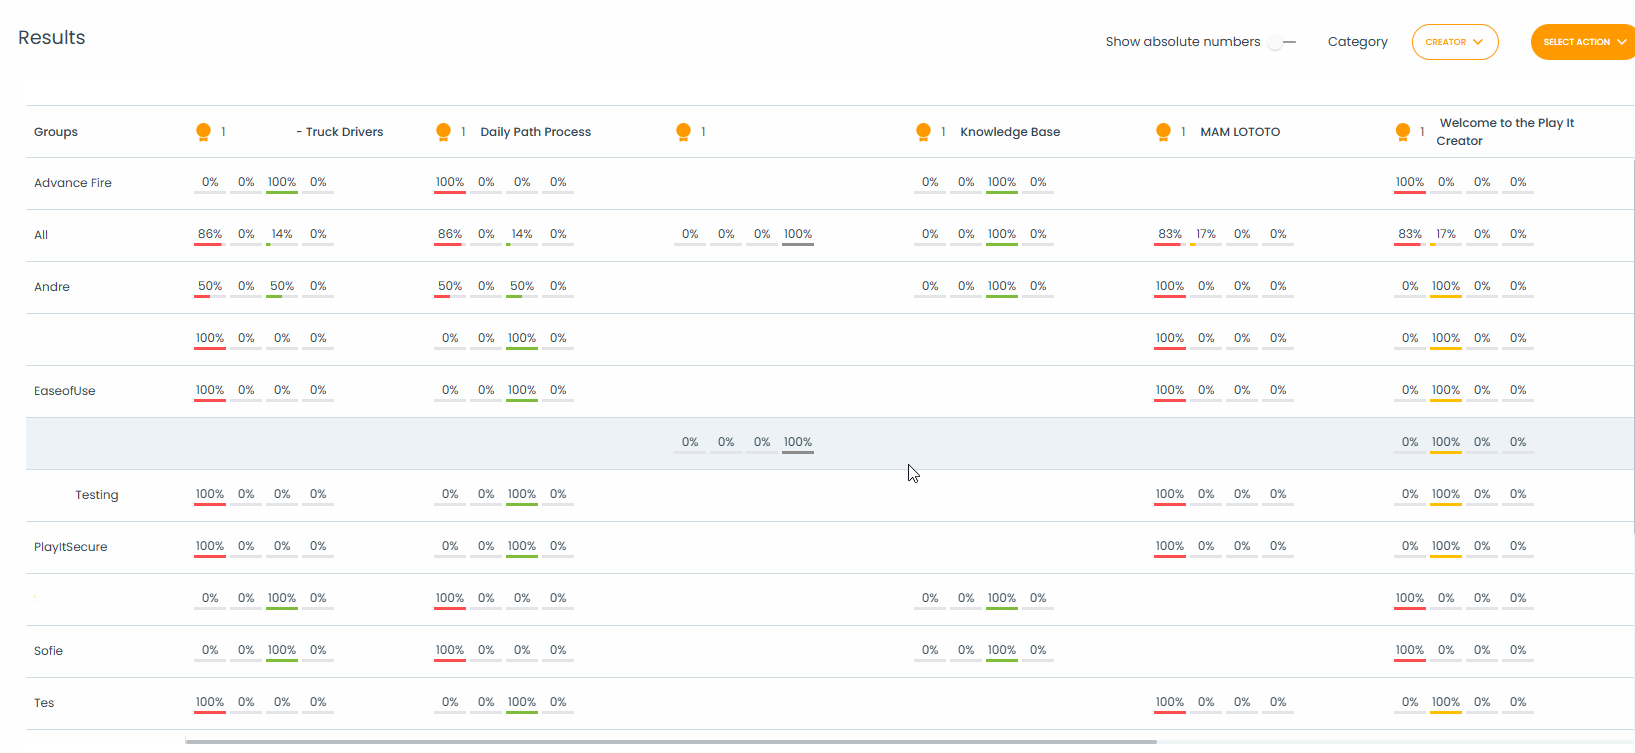
The group progress is shown by the use of 4 statuses.
![]()
Per group a percentage is shown for the different statuses divided by the courses.
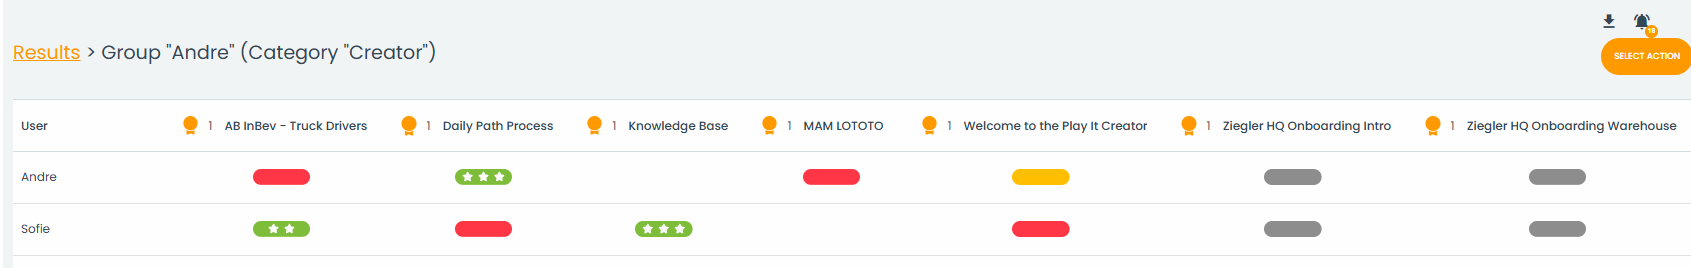
You can also click on the group name, to get a more in-depth view on the progress of the specific group.
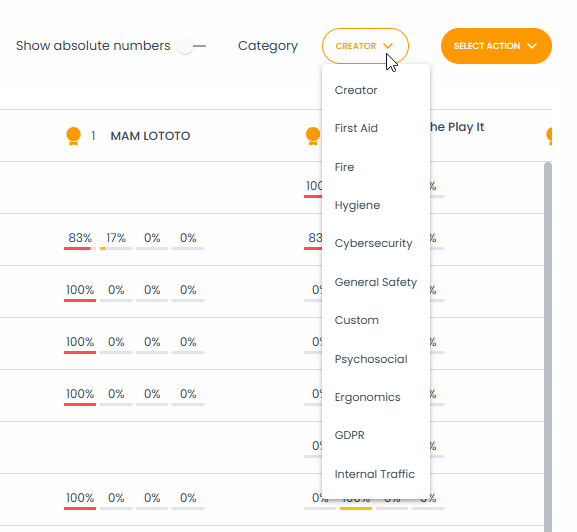
To keep the overview concise, results are filtered by category.
To see the results of another category, use the drop down on the top and select the wanted category.
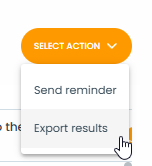
With the button 'Select Action' you can export the results in an Excel format:
You will then get the following pop up:
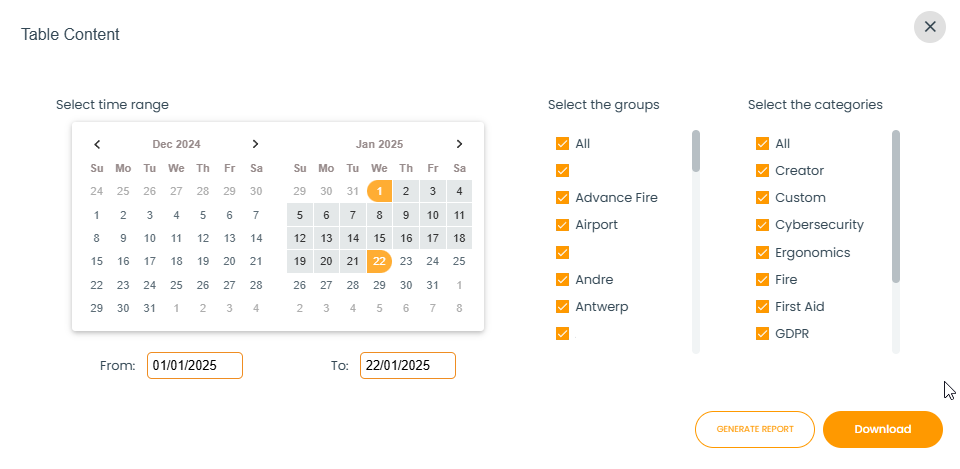
Select the time range on the left and select all the groups and categories of which you want to export the results.
If your selection is final, click on the 'Generate report' button.
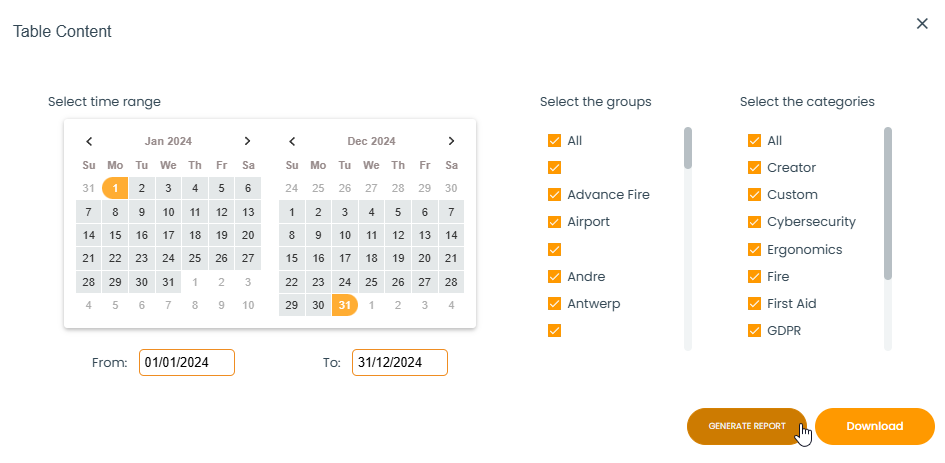
The report gets generated and once this is successful, you can download the Excel report by clicking the 'Download' button.
Once downloaded, you can open the report in Excel.
Important: If you do not generate a new report, clicking on the download button will download the last generated report. If you want different data than that one, you must generate a new one.